

KyPlot 6.0
Processes data for generating statistics reports
Program info
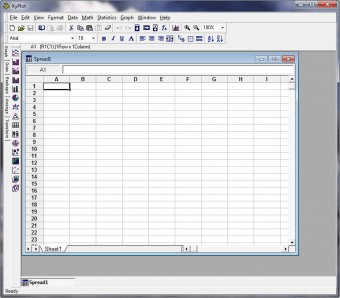
Work with all types of databanks, import information to be processed in the integrated environment for performing the analysis of input values with computing and statistical methods on a spreadsheet interface. The results are visualized as graphs. Presenting the output data in a slideshow is possible.
KyPlot offers you an integrated environment for data analysis and visualization. In KyPlot you can analyze data with a broad range of computing and statistical methods on a spreadsheet interface, and visualize the results as versatile graphs.
1. Spread Window
A spread window contains Excel-compatible spreadsheets, supporting calculation with cell formulae. KyPlot provides a wide range of computing methods such as mathematical optimization, spectral, time-series and wavelet analysis. It also offers a variety of statistical procedures including parametric and nonparametric tests and multivariate analysis.
2. Figure Window
You can create graphs and draw schemes in figure pages in a figure window. KyPlot provides versatile options to customize every aspect of a graph and you can easily create publication-ready, high-quality graphs. It also offers many fitting methods including nonlinear fitting, interpolation and smoothing.
In version 3, multiple pages can be created in a figure window and you can perform a screen show of the pages.
Details
Extensions

No information available
The data will be available later.


Comments