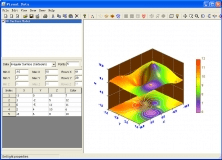
Digitize a scanned graph or chart into (x, y)-data.
Plot math equations and scatter points using equations and data points.
Scientific data visualization application.
Useful tool that helps all the users.
A tool that allows you to visualize mathematical functions and curves.