KyPlot 5.0

KyPlot offers you an integrated environment for data analysis and visualization
4.6 
Rating
Your vote:
Latest version:
6.0.2 See all
Developer:
KyensLab Inc.
Screenshots
1 / 3
Awards (1)
Show all awards
Software Informer Virus Free award
Download
18 MB

KyPlot offers you an integrated environment for data analysis and visualization. In KyPlot you can analyze data with a broad range of computing and statistical methods on a spreadsheet interface, and visualize the results as versatile graphs.
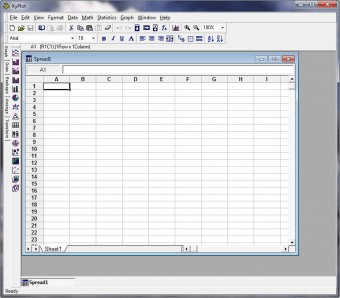
1. Spread Window

A spread window contains Excel-compatible spreadsheets, supporting calculation with cell formulae. KyPlot provides a wide range of computing methods such as mathematical optimization, spectral, time-series and wavelet analysis. It also offers a variety of statistical procedures including parametric and nonparametric tests and multivariate analysis.
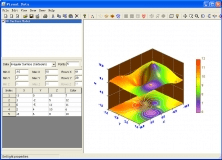
2. Figure Window

You can create graphs and draw schemes in figure pages in a figure window. KyPlot provides versatile options to customize every aspect of a graph and you can easily create publication-ready, high-quality graphs. It also offers many fitting methods including nonlinear fitting, interpolation and smoothing.

In version 3, multiple pages can be created in a figure window and you can perform a screen show of the pages.

Comments (5)

4.6
Rating
16 votes
5 stars
12
4 stars
2
3 stars
2
2 stars
0
1 stars
0
User

Your vote:

A
Aisha Ibrahim
When I do simple regression, massage appears saying that 'too small data' how to deal with it?

Nov 12, 2022 Was it helpful?  yes(0) no(0) | Reply
D
rating dr.imad
It's my best software

Was it helpful?  yes(0) no(0) | Reply
D
rating Dr. Jwalant Travadi
Best statistical software

Was it helpful?  yes(0) no(0) | Reply

Related software

DigitizeIt
DigitizeIt
rating

Digitize a scanned graph or chart into (x, y)-data.

Graphing Calculator 3D
rating

Plot math equations and scatter points using equations and data points.

Visual Data
Visual Data
rating

Scientific data visualization application.

Cumulative Probability Plot
Free
rating

Useful tool that helps all the users.

Z-Plot Premium
Z-Plot Premium
Free
rating

A tool that allows you to visualize mathematical functions and curves.

Related suggestions